This is the second article in a series which discusses some difficult theoretical questions with which appraisers have been confronted in a very practical way. This article will pick up where the last one left off, so you will definitely want to read Part 1 of this series before continuing. With that said, let’s move forward with the second question: How do I reconcile comparables with a wide range of adjusted sales prices?
To answer this question, let’s return to probability theory for some help. As you recall, a normal distribution (bell curve) is one where the highest probability is represented by the top of the curve. In fact, with a normal distribution the mean, median, and mode are all represented by the top of the curve. Since market value is defined as the most probable price (with stipulations, of course), if your distribution is ‘normal’, then each of those measures will point to the same conclusion.
Let’s apply this in terms of adjusted sales prices. A comparable sale is an indicator of market activity between a particular buyer and seller. To make that indicator applicable for the subject property, the indicator is adjusted to reflect what we think that transaction would have looked like if the subject property were in the place of that comparable property with the same buyer and seller. Multiple comparables will form a range (distribution) of adjusted sales prices which can be viewed the same way that we viewed the array of multiple offers in Part 1. Therefore, we can, in similar fashion, plot those adjusted sales prices on a bell curve. If we knew that they reflected a normal distribution, then the mean, median, and mode would all be great ways to reconcile those adjusted sales prices. Wait, hold on for a minute, that is a big ‘if’! How do we know if our adjusted sales prices reflect a normal distribution? What if we suspect that the distribution is not normal?
It is important at this stage to take a step back and make some acknowledgements that we can delve more into later. First, a good reconciliation can’t make up for bad comparable selection and analysis. Second, the number of comparables is important. With more sales, comes greater understanding of your distribution, which in this case is reflecting your market. Third, a wide range of adjusted sales prices does not necessarily mean that you did something wrong. While it could indicate that you are missing something, it could also indicate that you are in a market with more erratic pricing. In the language of statistics, this would be termed as a distribution with a high variance (this looks like a flatter, wider curve instead of a low variance distribution which has a taller, narrower curve). Remember, it is not up to the appraiser to make the data look a certain way. If your market has a high variance in pricing, then it is not appropriate to artificially manipulate the data in order to make your variance smaller. There is a line between sensitivity analysis and data manipulation that you don’t want to cross.
So, back to the question of how to recognize if you don’t have a normal distribution, and then what to do about it. This is where the coefficient of skew comes into play. The coefficient of skew is a number which describes how the data is distributed. This can be easily calculated, but it is better to start by visualizing it.
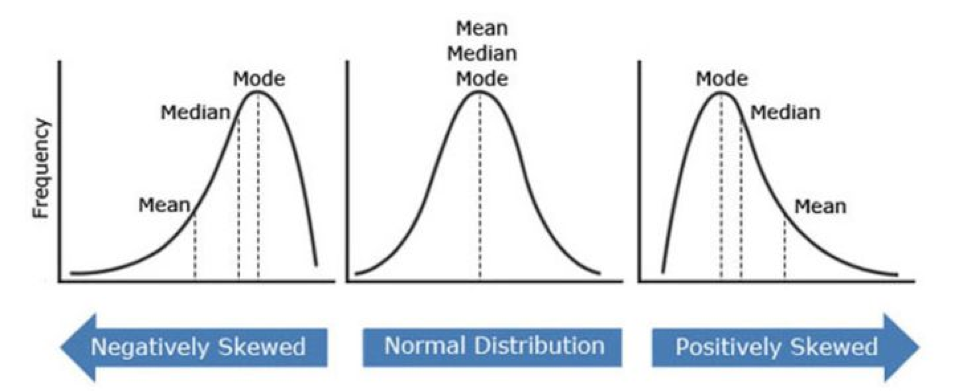
When your distribution has a tendency to have more outliers toward the low end of the range, it is a negatively skewed distribution (figure on left). You will most often see this reflected in your data when you are in a buyers market, and especially when market conditions exist that tend to create more distressed sellers.
When your distribution has a tendency to have more outliers toward the high end of the range, it is a positively skewed distribution. You will most often see this reflected in your data when you are in a sellers market, and especially when market conditions exist that tend to create more frenzied buyers.
In either case, you will note that the mean, median, and mode no longer reflect the same value. If your method of reconciliation includes an average, or even a weighted average, then you are in danger of overstating or understating the point of highest probability. While the median tends to be closer, it too is susceptible to skew.
So, how do you deal with skew? The first step is to identify if your distribution is skewed. This does not have to be a mathematical calculation in most cases, although it is easy to calculate in any spreadsheet software. The vast majority of appraisers recognize the outlier in their adjusted sales prices right away. Simply ask yourself, “Which adjusted sales price is the least consistent with the other ones?” Once you recognize the outlier, remove it from your reconciliation calculation. You don’t need to remove it from your grid, just the calculation. In fact, leaving it in your grid drives home the point you are probably already making about your market conditions. You are just dealing with it the way that outliers are dealt with statistically, so that the calculation of the most probable value is not skewed. If you are using a weighted mean (which is my preferred method), you can always remove both the high and low adjusted sales prices (this is called a modified mean and is a common approach to dealing with skew). It doesn’t always have to be both the high and the low. This is where you as the appraiser use your best judgement in the manner which best reflects the most probable price. As a practical matter, it is good to let your active inventory influence how you remove an outlier. If I have an outlier at the high end of my range and it is above current inventory pricing, I will often remove only that outlier, provided that I don’t have a clear outlier at the low end of my range. The same would apply if your current inventory prices are higher and you have a sale at the low end of the range which is less consistent. In my software, revising these calculations is as easy as a mouse click. I will often ‘click’ through several versions of the reconciliation calculation as I am nearing the end of my analysis.
Let me state something clearly at this point. I’m not trying to add more work. I don’t regularly insert my data into a probability plot or calculate my variance and skew. While I’m happy to share the specifics of how to do that, it is not the purpose of this article. The purpose is to use the theory to help you to see your data better, to understand your market better, and to be the credible source of information that your clients need you to be.
Keep your eye out for Part 3, which will use probability theory to help with your comparable selection and analysis. It will be especially useful in demonstrating a potential major pitfall of paired sales analysis.
Have any comments or would you like to submit content of your own? Become an Appraisal Buzz Forum Member and comment below or email comments@appraisalbuzz.com.
Share this article
Written by : Brent Bowen
Brent is the president of Texas Valuation Professionals, Inc. (www.txvaluepro.com) in Plano, Texas and has been appraising residential real estate in north Texas for 25 years. He graduated from Baylor University with an enthusiasm for both economics and real estate, which made real estate appraisal a perfect fit. Rarely satisfied with the status quo, Brent hopes to always be open to further development, both professionally and personally.
3 Comments
Comments are closed.
Oops, it looks like they forgot to insert the figures referenced in the article. Hopefully, they will revise this and post it with the referenced figures!
A very basic analysis was not mentioned. Contact the r.e. agent regarding the transactions. Note to ask what was the traffic for the listing , any unusual motivation, what were the terms or concessions and any unusual features that were noted by buyers. This is especially important on luxury or unusual properties. If this is a court case, I recommend contacting the list and selling agent. You will be surprise at the different answers. I use the law of large numbers as added support.
I did not intend to suggest that there is no need to assess the ‘why’ question of a particular data point, which is what the analysis you are referencing does. I am suggesting a way of looking at the totality of the data. This can help you understand the reason that distributions look the way that they do, and more importantly how that understanding can shape the analysis and conclusions in your appraisal. Of course, the missing illustration sort of adds an element of confusion which I’m trying to get resolved with the editor now.