For parents of kids at a certain age, the next few months mark the beginning of the dreaded Science Fair season. Building solar ovens on a cloudy day, tracking down trifold cardboard displays, and cleaning up super glue is not my idea of a good weekend. Although, I hate to admit, the scientific method is pretty valuable…even for appraisers.
The scientific method can be a path which leads to much more credible appraisals; not to mention faster, more supportable, and more accurate. In my practice, this plays out through the creation and testing of formulas, since the scientific method is as applicable in the fields of mathematics and statistics as it is in the physical sciences.
Step 1: Question
This is the easy part. What do you want to know? For example, let’s narrow this down to an adjustment in the sales comparison approach. Our question might be: “How much should I adjust for an extra garage space?”
Step 2: Research/Observation
This is when you will want to gather information already available. I recommend starting this with general observations and logic. Regarding our garage example, we might start with answering these types of questions:
- What have you observed about how buyer’s react to additional garages?
- Do buyers react differently based on the price range, size, quality, or other features of the home?
- How many garages are enough for most buyers, how many garages are too many?
Let me digress for a moment and reflect on the cautionary tale that we’ve all heard. It goes like this: Don’t be the appraiser who finds himself defending an adjustment by saying “the adjustment is based on my 30 years of experience.” While that cautionary tale is completely valid, let’s also not discount that 30 years of experience. Chances are many of the appraiser’s conclusions from those 30 years of experience aren’t wrong, they just haven’t been properly quantified, tested, and validated.
With that said, stop and think about how you have encountered this question in the past. List all the observations that you make. Relationships are more important here than solid numbers. Keep in mind that you don’t have to prove any of these yet; in fact, it is likely that some of your observations may not be accurate.
Then take a look at prior research, available cost data, surveys, interviews, etc. At least some of this data will be quantitative in nature, allowing you to begin to put numbers to your observations. Putting numbers to those observations will help you develop a formula for how the market reacts.
Step 3: Hypothesis
This formula becomes your hypothesis. It takes into consideration your observations and research and becomes a mathematical expression of your interpretation of that data. In our example, you might have observed that the typical contributory value in a neighborhood at a $500,000 price point was around $8000 per garage space. You also noticed that homes with less than the typical number of garages had a larger reaction and homes with a greater number of garages had a lesser reaction. You hypothesize that that difference is 25%. You also noticed that there was a correlation with price range and gross living area. Larger and higher priced homes tended to have a higher contributory value. You hypothesize that the difference is 5% for $100,000 in price point. Our formula might then be something like this: A + B + C = G
Where:
A = Base Value (Hypothesis=$8000)
B = Premium or Loss per $100,000 difference in price point (Hypothesis=5%)
C = Premium or Loss depending on normal number garages (Hypothesis=25%)
G = Contributory Value of Garage
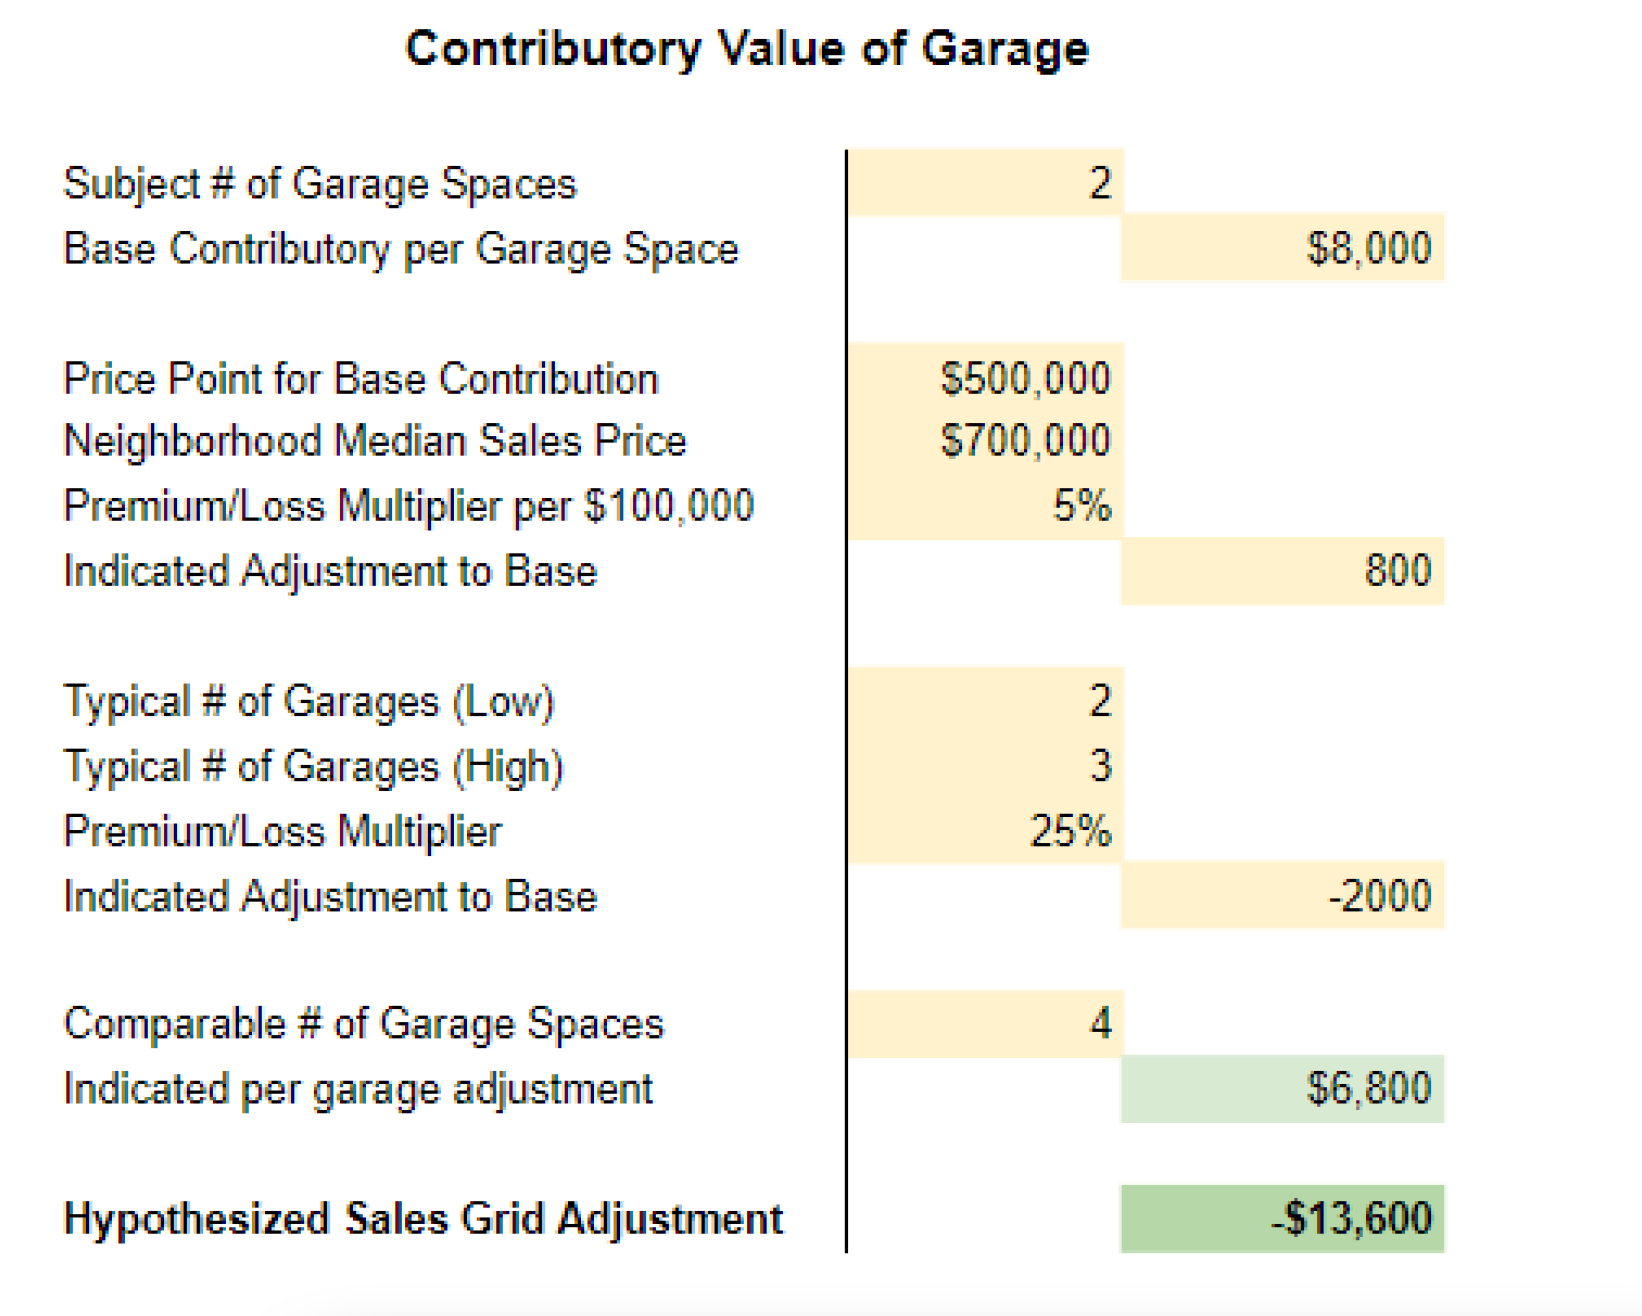
Your spreadsheet might look like this:

For the sake of our example, what if the subject has a 2 car garage and is located in a neighborhood with a median sales price of $700,000 which typically has homes with either 2 or 3 car garages. If you apply this to a comparable with a 4 car garage, the result would be as follows:
 You may decide that for this hypothesis you will leave the size of the home out of the equation as you think that it is already considered to a large extent in the neighborhood price point. Keep in mind that this is only a hypothesis. Your initial formula may feel like you are just ‘throwing numbers’ at the question. That’s OK, because it is merely a hypothesis. You aren’t ready to rely on it, as it hasn’t been tested yet.
Step 4: Test/Experiment
You can then take the formula and apply it to many different case studies. As a practical matter every appraisal that you prepare could be a case study for testing your formula. You could also create your own case studies to apply the formula through a variety of scenarios. In each scenario you will have data that suggests the extent to which the formula was an accurate predictor of the market reaction. You can measure this relative to another method of adjustment support, or relative to the results of a sensitivity analysis within a set of sales.
The likelihood of your first hypothesis being perfect is very low, and that is OK. In fact, there is no such thing as ‘perfect’. Perfect isn’t the goal. Logical, functional, reliable, and understandable are the goals. Failure in this step is valuable. Ask the question, why didn’t this seem to work in this case? Did this test reveal variables that I haven’t yet considered?
Step 5: Repeat
Every test, whether successful or not, becomes another observation which feeds the scientific method cycle. Those observations result in a revised hypothesis. In our example we might observe that the 25% premium or loss for being outside of the norm of the number of garages didn’t really fit as well as you thought it would. Maybe that influence was much more subtle than you thought, or maybe couldn’t be evenly applied (which tells you that there may be another variable which needs to be added to your formula). Maybe you decide that GLA was a better predictor than price point and change that part of the formula. Sometimes, you will want to scrap the entire formula and rethink it. Sometimes, you will add a variable, or maybe decide that more than one formula can be used in tandem to create a range of predictions.
Conclusion
After enough iterations, you will develop formulas which have been thoroughly tested. Through this testing you will have demonstrated a track record of how predictive your formula is of the market reaction. You will have verifiable data which has validated and supported your method. If we think back to the cautionary tale, what if the appraiser were able to say, “With 30 years of research, observations, and testing, I have developed a method which is an accurate predictor of the market reaction for this feature in at least 95% of case studies. That method was employed in this appraisal.” Instead of a cautionary tale, that appraiser becomes an example of industry excellence, increasing public trust and confidence not just in his or her own work, but in the appraisal profession as a whole.
While this concept may seem daunting at first, it is in many ways a formalization of a process which you are already unconsciously undertaking for each assignment. Although the initial iterations can be time consuming, the long term benefits are incredible. A well-designed spreadsheet can handle many interconnected and complex formulas and make this process quick and easy. In my business, we have developed formulas which provide supported ranges for the vast majority of adjustments encountered in our appraisal practice. In some cases, there are multiple formulas which provide the appraiser with more than one perspective on how to interpret the data. These formulas are regularly tweaked and adjusted as markets change and new methods are tested. With just a minute or two of entering basic pieces of information, we have the results of hundreds of often complex calculations which have been validated by thousands of cases.
By the way, if you haven’t paid for Excel, this works just as well with Google Sheets, which is free. If you have never used Excel/Google Sheets before, I’d recommend taking a few tutorials online. Google Sheets has an integrated tutorial in their ‘Help’ menu, and of course YouTube is a fantastic resource.
For those that are interested, I’ve been working on a training curriculum, including spreadsheet templates, to help other appraisers get up and running faster. If that sounds like something you would be interested in, send me an email and you’ll be the first to know when it’s ready.
Even with help you won’t have this worked up overnight, but it might be easier than you think. One thing is for certain, it’s easier than getting your kid’s science fair project to school on a windy day without dropping the paper-mache volcano.
Share this article
Written by : Brent Bowen
Brent is the president of Texas Valuation Professionals, Inc. (www.txvaluepro.com) in Plano, Texas and has been appraising residential real estate in north Texas for 25 years. He graduated from Baylor University with an enthusiasm for both economics and real estate, which made real estate appraisal a perfect fit. Rarely satisfied with the status quo, Brent hopes to always be open to further development, both professionally and personally.